
India · Economics · Data
What does the data say about India's economy right now?

Ekopregledv cuts through the noise with fact-checked, data-first reporting on the numbers shaping everyday Indian life.
Real numbers, plain language
We believe the best economic journalism starts with the dataset, not the opinion.
India's economy generates an enormous volume of data every week — from the Consumer Price Index released by the Ministry of Statistics, to EPFO enrolment figures, GST collection tallies, and quarterly GDP revisions. Most of that data sits behind jargon-heavy press releases that busy readers don't have time to decode. Ekopregledv exists to close that gap. Our reporters read the primary sources first, then explain what the numbers mean for salaried workers in Hyderabad, farmers in Vidarbha, or small business owners in Surat. Emerald-fresh charts and clearly labelled tables make every story scannable whether you're on a desktop or a phone.
Five beats, one newsroom
Every story we publish belongs to one of five tightly defined coverage areas — so you always know what you're getting.
-
Macro-Economy
GDP growth, inflation trends, fiscal deficit, and RBI monetary policy decisions — tracked each quarter with annotated data tables and year-on-year comparisons sourced from official government releases.
-
Business
Corporate earnings season coverage, sectoral output indices, and regulatory changes that affect how Indian businesses operate, from startup ecosystems in Bengaluru to steel plants in Jharkhand.
-
Labour Market
EPFO enrolments, PLFS survey findings, gig-economy data, and state-level unemployment figures explained in terms of what they mean for workers seeking stable income and fair wages.
-
Policy
Budget analysis, parliamentary committee reports, and ministry notifications decoded — we track the lifecycle of an economic policy from announcement through implementation to measurable outcome.
-
Household Budget
Food price monitoring, fuel cost trends, EMI burden analysis, and purchasing-power comparisons that show how macro shifts land in a typical Indian household's monthly spend.
What our readers say
I've been following economic news for fifteen years, and Ekopregledv is the first outlet that showed me the actual PLFS microdata table instead of just quoting a headline figure. That June 2023 piece on urban female labour force participation changed how I thought about the numbers entirely.
Ramya Krishnan, policy researcher, Hyderabad
Start reading the data behind India's growth story
New analysis published every week. No paywalls, no jargon walls.
Why data-driven journalism matters more than ever
Opinion is cheap; a well-sourced dataset is not.
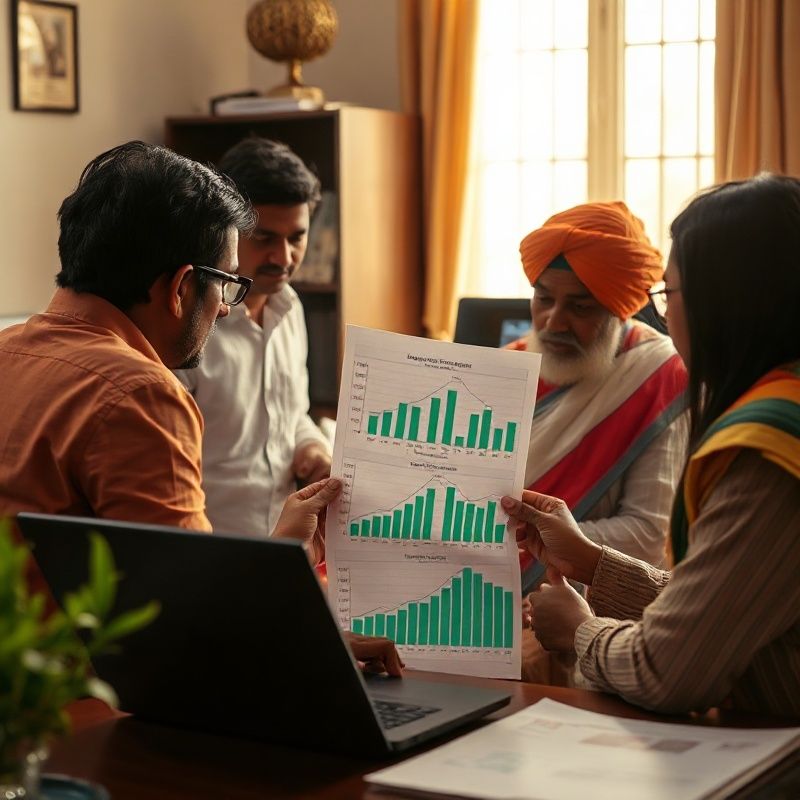
In an era when economic headlines move markets and shape election narratives, the difference between a precise figure and a vague assertion can be enormous. Ekopregledv was built around a single editorial discipline: every claim must be traceable to a primary source — a government statistical release, a peer-reviewed research paper, or a verified company filing. When the source changes its figures after a revision, we update our stories and flag the change. Our emerald-fresh visual style — clean white space, bold green data callouts — is deliberately designed to make it easier to spot the key number in any story, not to dress up thin reporting. We cover what the data shows, and we're honest about what it doesn't yet show.
When the Q2 FY24 GDP data dropped at an unexpected 7.6%, I opened Ekopregledv before any other site. Within three hours they had a breakdown of sectoral contributions with an actual data chart — not a screenshot of someone else's chart. That kind of primary-source speed is rare in Indian digital media.
Aditya Mehta, economics lecturer, Pune
Common questions about Ekopregledv
Straight answers about how we work and what you can expect from us.
Is Ekopregledv free to read?
Yes — every article we publish is freely accessible. We believe that clear economic journalism is a public good, and we don't want an ability-to-pay barrier to stand between a curious reader and a well-sourced explanation of India's CPI or fiscal deficit.
How often do you publish new analysis?
We publish new long-form analysis at least twice a week, timed around major data releases — RBI policy decisions, CSO statistical releases, quarterly corporate results, and PLFS survey drops. Breaking data is usually covered within hours of the official release.
Do you offer investment advice or stock tips?
No. Ekopregledv is a journalism and analysis outlet, not a financial advisory service. We explain what economic data means and what policy changes have historically been associated with — we never tell you what to buy, sell, or invest in.
Where do your data sources come from?
We draw primarily from MOSPI releases, RBI publications, Ministry of Finance documents, EPFO monthly payroll data, and peer-reviewed academic papers. Every story links to the primary source so you can check the numbers yourself.
Can I pitch a story or share a dataset with your team?
Yes, and we welcome it. If you've found an interesting dataset or have a regional economic story that the national press is missing, write to us at info@ekopregledv.info. We read every message, though we can't guarantee a response within a fixed time frame.